


I did not publish The Markets Compass Crypto Sweet Sixteen Study in its entirety last Saturday. I was a “little busy” with my daughter’s wedding on Saturday, but I want to share my thoughts on the technical condition of the broader cryptocurrency market utilizing price charts of the CCi30 Index*
*For those who are not familiar, the CCi30 Index is a registered trademark and was created and is maintained by an independent team of mathematicians, quants and fund managers lead by Igor Rivin. It is a rules-based index designed to objectively measure the overall growth, daily and long-term movement of the blockchain sector. It does so by indexing the 30 largest cryptocurrencies by market capitalization, excluding stable coins (more details can be found at www.CCi30.com.
The CCi30 Index Cloud Chart with Momentum Oscillators
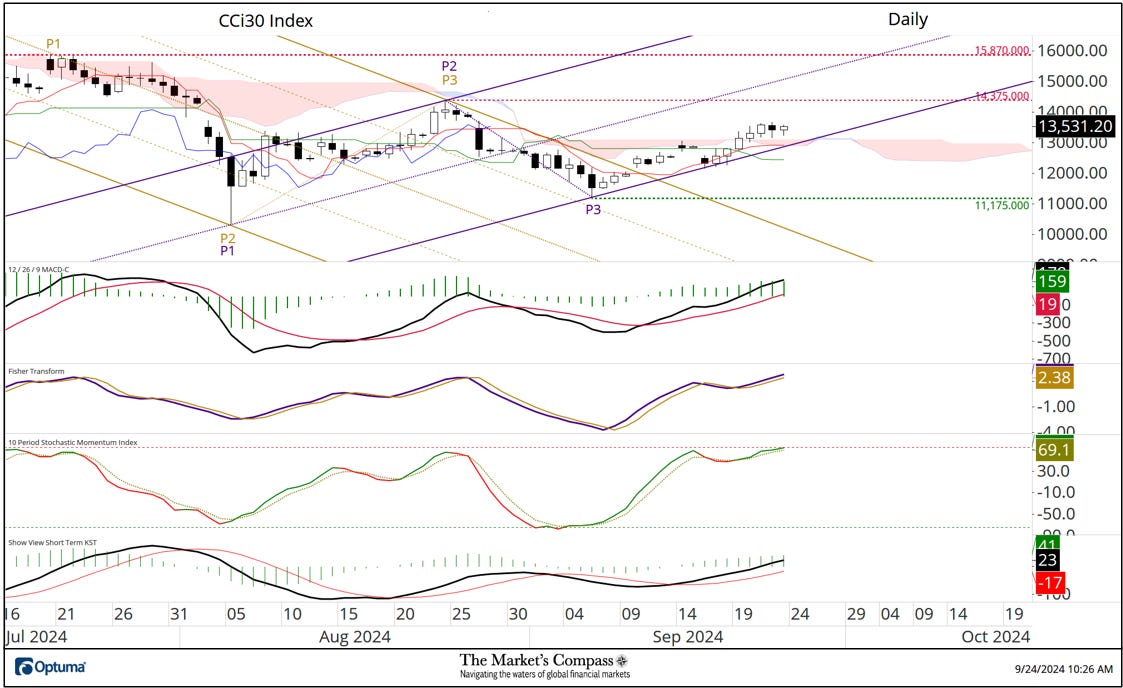
When the CCi30 Index overtook the Upper Parallel (solid gold line) of the longer-term Inverse Standard Pitchfork which is drawn from a price pivot high (gold P1) to a price pivot low (gold P2) to price pivot lower high (gold P3) I added a second Standard Pitchfork (violet P1 through P3). Since the violet P3 low prices have walked the “tight rope” of the Lower Parallel (solid violet line). Last Friday the index overtook Cloud resistance at what is commonly referred to as the “twist” (the easiest point for prices to overtake Cloud resistance) and prices have held Cloud support since then (prices are as of yesterday). All four momentum oscillators suggest the index still has the wind at its back, but it may, in the very short-term be a tad extended. I now mark first short-term resistance at 14,375. The next Daily Chart reveals one concern.
The CCi30 Index Daily Cloud Chart with the MC Oscillator and the Custom Oscillator
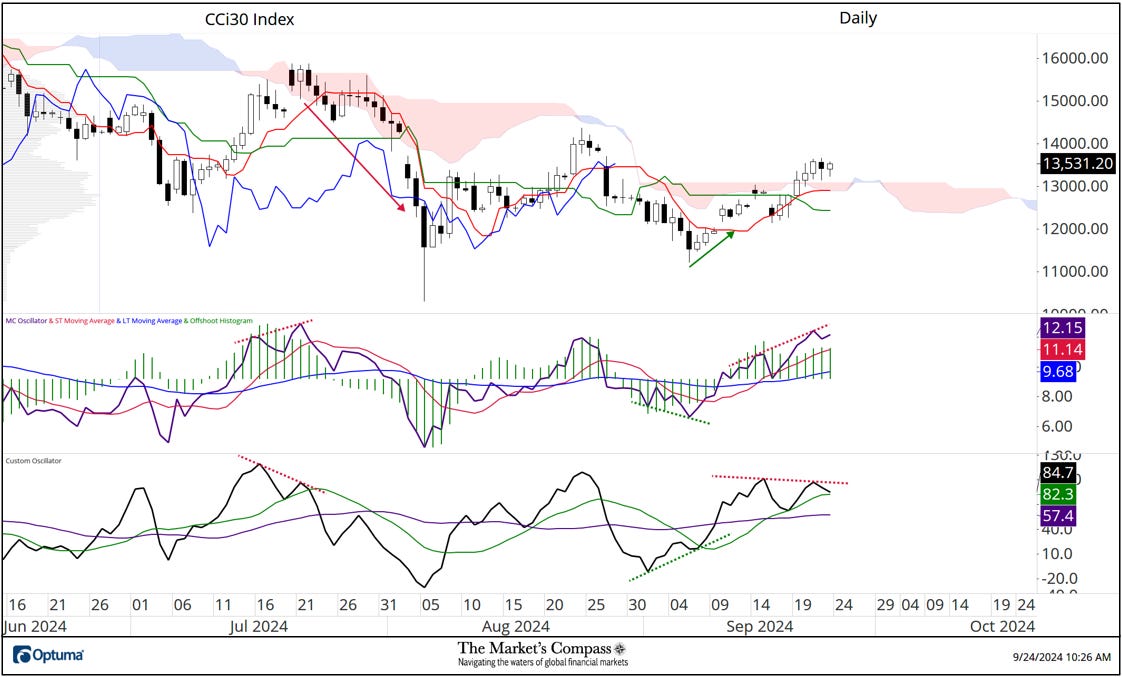
The Custom Oscillator (lower panel) is an unbound momentum oscillator that has an embedded momentum calculation that removes the normalization range restrictions that are in the MC Oscillator (middle panel). That means that it is not bound between 0 and 100. I have highlighted three divergences. The first was in July, which was a bearish divergence and is highlighted with the red dashed lines. You can see what happened after that (red arrow). The second early September divergence is a bullish divergence highlighted with the green dashed lines suggesting a potential price low was in place and is highlighted with the green arrow. In the middle of this month a bearish divergence began to develop. The current bearish divergence is not as “full blown” as the one in July and is likely signaling only a shallow pullback of a lesser degree or a “pause to refresh” in the index. That short-term technical thesis is potentially reinforced by the weekly technical condition (charted below) that reflects the current position of the same two oscillators that printed a bullish divergence in the third quarter.
The CCi30 Index Weekly Cloud Chart with the MC Oscillator and the Custom Oscillator
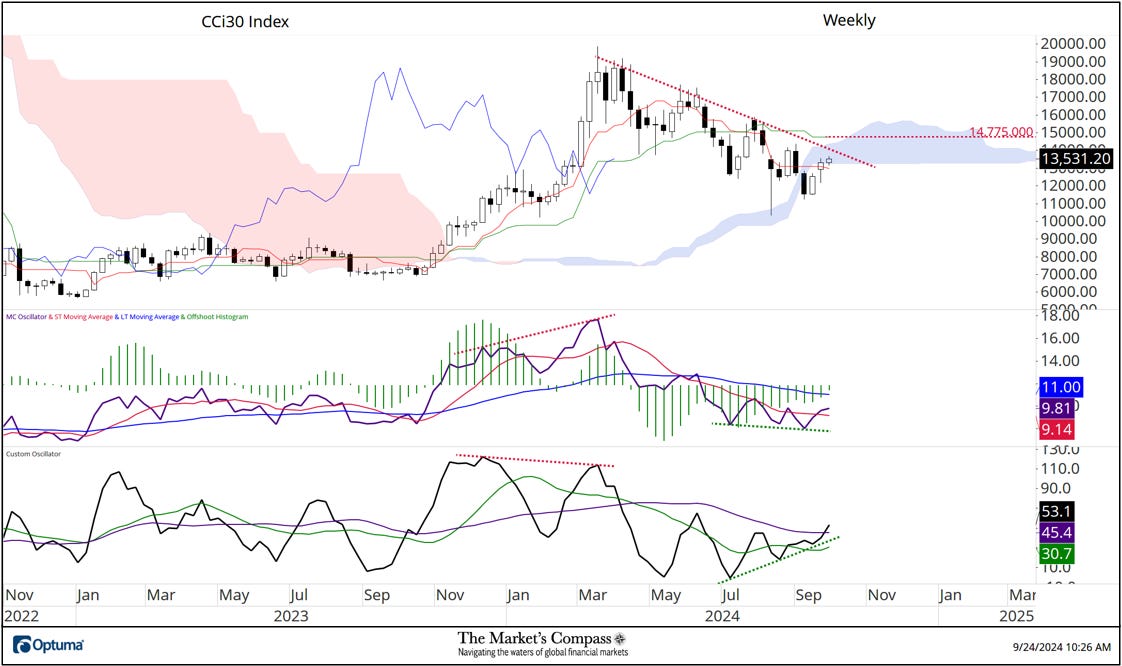
Prices have remained mired in the multi-month downtrend (red dashed line) since March highs but there is one ray of hope for the cryptocurrency bulls, which is the recent bullish divergence between the two oscillators (green dashed lines). It should be noted that the divergence is less than perfect because of the time between the lows but it is nonetheless noteworthy. The week is not over yet, but the index has edged above the Lower Span of the Cloud. Three key hurdles remain. First is resistance at the downtrend from the March highs (red dashed line), second is the Upper Span of the Cloud model and lastly the Kijun Plot (the mid-point between the lowest low and highest high over the past 26-weeks) which currently at 14,775. If those hurdles are overtaken, I would be able to confidently declare that the CCi30 Index is “out of the woods” and on its way to higher price levels!
All of the charts are courtesy of Optuma whose charting software enables users to chart any price data such as the CCi30 Index.
To receive a 30-day trial of Optuma charting software go to…
www.optuma.com/TMC.
A three part tutorial on Median Line Analysis AKA Andrews Pitchfork and a basic tutorial on the Tools Technical Analysis is available on my website…
www.themarketscompass.com


